
A structured review of published studies showing significant correlations between Gas Discharge Visualization parameters and heart rate variability, EEG, blood biomarkers, and clinical diagnostics — and what that convergence means.
What happens when two completely independent measurement systems point to the same physiological signal? In biomedical research, convergent validity — the degree to which separate instruments measuring related constructs agree — is one of the strongest markers of scientific credibility. A growing body of peer-reviewed research shows that GDV, the technology behind Bio-Well, correlates significantly with HRV, EEG, blood biomarkers, and clinical diagnostics across multiple study designs.
What Convergent Validation Means and Why It Matters
Any novel measurement technology faces a fundamental challenge: how do you establish that what it measures is real? One rigorous approach is to compare outputs against established gold-standard methods under the same experimental conditions. When an instrument consistently tracks the same physiological phenomena as a validated benchmark — even through an entirely different physical mechanism — that agreement carries substantial evidential weight.
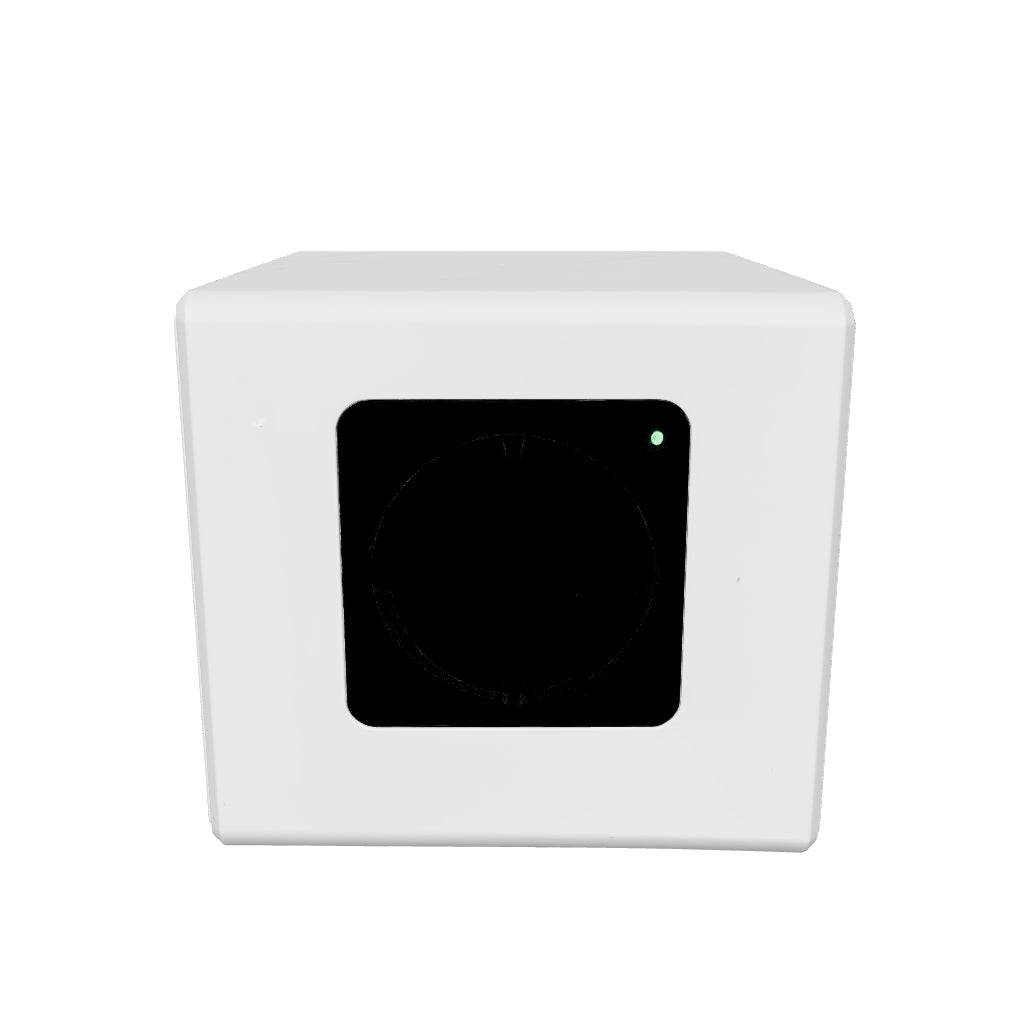
Bio-Well measures the photon emission profile of a fingertip placed under a pulsed high-voltage electromagnetic field — a phenomenon called Gas Discharge Visualization (GDV). The resulting images encode information about the intensity, geometry, and entropy of that emission. Researchers hypothesized these parameters should reflect aspects of the autonomic nervous system (ANS) state, metabolic activity, and psychophysiological stress — the same constructs that HRV and EEG are already validated to measure.
The question was simple: do they actually agree?
GDV and Heart Rate Variability: The Glenn Study (2004)
One of the earliest and most rigorously designed correlation studies was conducted by Glenn et al. (2004), testing 28 healthy adult volunteers across four experimental conditions: resting baseline, orthostatic challenge, vigorous physical exercise, and dark chocolate consumption. HRV power spectral analysis — measuring VLF, LF, HF, and LF/HF ratio — was recorded alongside full ten-finger GDV scans across all conditions.
The GDV Stress Index correlated with the sympathetic HRV marker (LF) at r = 0.85 during exercise — a correlation considered strong in physiological research. Under the positive emotional condition (chocolate), Stress Index correlated with LF/HF balance at r = 0.81. GDV Entropy correlated with HRV parameters consistently across all four experimental conditions.
These correlations were statistically significant at p < 0.05 and replicated across multiple experimental states — including both sympathetic-dominant (exercise, orthostatic) and parasympathetic-dominant (rest, positive emotion) conditions. That consistency across different physiological states is what distinguishes a robust finding from an incidental one.
The Raw Data: Glenn Table 1 (Statistically Significant Correlations Only, p<0.05)
| Condition | GDV Parameter | HRV Parameter | Fingers | r Value |
|---|---|---|---|---|
| Background (rest) | Normalized Area | RRNN | 5R | 0.68 |
| Background (rest) | Area | VLF | 5L, 5R | 0.64 |
| Background (rest) | Area | LF/HF | 5L–5R | 0.61 |
| Background (rest) | Entropy | LF | 5L–5R | 0.64 |
| Background (rest) | Brightness | RMSSD | 5L–5R | 0.61 |
| Orthostatic | Brightness | VLF | 5L–5R | 0.71 |
| Orthostatic | Entropy | VLF | 5L deviation | 0.65 |
| Ortho – Background Δ | Brightness | VLF | 5L–5R | 0.71 |
| Ortho – Background Δ | Entropy | VLF | 5L deviation | 0.66 |
| Exercise | Stress Index | LF | 10 fingers | 0.85 |
| Exercise | Entropy | VLF/HF | 10 fingers | 0.41 |
| Chocolate (positive emotion) | Stress Index | LF/HF | 10 fingers | 0.81 |
| Chocolate (positive emotion) | Entropy | HF | 10 fingers | 0.56 |
| Chocolate (positive emotion) | Normalized Area | LF/HF | 10 fingers | 0.51 |
Source: Glenn et al. (2004). Table 1 — only statistically significant correlations shown (p < 0.05).
HRV measures how the heart responds to ANS signaling — one of the most validated proxies for stress resilience and autonomic health in clinical research. The fact that GDV parameters track the same physiological state shifts through an entirely different physical mechanism (photon emission from fingertip skin) suggests both instruments are detecting the same underlying reality. The correlation held across sympathetic-dominant, parasympathetic-dominant, and emotionally positive states — not just one condition.
Full Summary of Validated GDV Correlations Across the Literature
The Glenn (2004) study established the HRV correlation, but it is far from isolated. Below is a structured compilation of GDV correlations from the peer-reviewed literature across multiple biomarker systems and study populations.
| GDV Parameter(s) | Correlated Biomarker / Method | Population | Notable Finding | Source |
|---|---|---|---|---|
| Stress Index, Entropy, Area | HRV (LF, HF, LF/HF, VLF, RRNN) | Healthy adults | r = 0.81–0.85 peak; replicated across 4 experimental conditions | Glenn et al., 2004 |
| GDV Entropy | EEG entropy; Immunocytogram; Leukocytogram | Mixed populations | Cross-system entropy correlates — shared signal across neural and immune systems | Korotkov et al. |
| Sector parameters | Fasting blood glucose | Normal, pre-diabetic, diabetic | GDV distinguishes glycemic states; potential non-invasive screening signal | EPI–Blood Sugar Study |
| Area, Intensity | Leukocytogram (WBC differential) | Clinical population | Causal relationships identified between GDV and immune cell parameters | GDV–Leukocytogram Study |
| Daytime GDV rhythmicity | Salivary biochemical parameters | Healthy volunteers | GDV follows same circadian oscillation pattern as saliva biomarkers | GDV Circadian Study |
| GDV + HRV combined | HRV during OSCE exam stress | Medical students | GDV detects acute exam stress consistent with HRV shifts | Nevoit et al., 2020 |
| Whole-hand parameters | EEG + HRV + Manual function | Children with spastic CP | All three measures shifted together after Kozyavkin rehabilitation | Kozyavkin et al. |
| Bioelectrograms | Clinical spirometry markers | Bronchial asthma patients | GDV patterns correspond with asthma severity classifications | Asthma GDV Study, 2004 |
| Antigen-antibody response | Serological immunoassay (ELISA) | Laboratory model | GDV detects antigen-antibody reaction dynamics in solution | GDV–Immunology Study |
| ML classification output | Pathology of internal organs | Patients with organ pathology | Machine learning applied to GDV achieves organ pathology classification | ML–GDV Organ Study |
| All studies accessible via the IUMAB Research Database: iumab.club/gb/science/research | ||||
GDV and EEG: Entropy as a Cross-System Signal
One of the most intellectually interesting findings in the GDV literature is the correlation between GDV entropy and EEG entropy. Entropy — a measure of complexity or irregularity in a biological signal — has become a central concept across neuroscience, systems biology, and clinical medicine. Higher entropy in biological signals is generally associated with adaptive capacity and healthy regulation; lower entropy reflects rigidity or pathology.
The finding that entropy measured at the fingertip via photon emission geometry tracks entropy in brainwave activity — a completely separate tissue system measured by entirely different physics — suggests that entropy may be a systemic property of biological organization, accessible through multiple measurement windows. This cross-system entropy correlation also extends to immune parameters (immunocytogram and leukocytogram), implying a shared organizational state that both neural and immune systems reflect simultaneously.
✓ Why This Matters for Practitioners
If GDV entropy correlates with both neural (EEG) and immune (leukocytogram) entropy, it may offer a non-invasive window into a systemic organizational state that traditional single-system tests only partially capture. This doesn't replace specialty testing — it contextualizes it.
Blood Biomarkers: Glucose, Immune Markers, and Circadian Rhythm
Two lines of study examine GDV's relationship with blood chemistry. The correlation with fasting blood glucose across normal, pre-diabetic, and diabetic participants shows that GDV parameters differ significantly across glycemic states — not as a diagnostic replacement, but as a parallel physiological signal reflecting the metabolic environment. The circadian study found that GDV parameters follow the same daily oscillation patterns as salivary biochemical markers, confirming the technology responds to the body's natural physiological cycles rather than producing measurement noise.
The GDV–leukocytogram study is particularly notable: it identifies causal relationships, not merely correlations, between GDV discharge parameters and white blood cell differential counts. If replicated at scale, this finding could have meaningful implications for non-invasive immune function monitoring.
Cerebral Palsy and Multi-Modal Convergence
In children with cerebral palsy undergoing the Kozyavkin rehabilitation method, GDV measurements tracked alongside improvements in manual function, EEG, and HRV — all three measures moving in the same direction following intervention. This multi-instrument convergence in a pediatric clinical context is particularly notable because it demonstrates that GDV captures treatment-related change, not just stable baseline differences between populations.
What the Convergence Tells Us
No single correlation study proves that GDV measures any specific biological construct with diagnostic precision. But the pattern across a decade of published research is consistent: GDV parameters — particularly Entropy, Stress Index, Area, and Normalized Area — respond to the same physiological states as HRV, EEG, and immune markers. They do so under experimental manipulation, in clinical populations, across pediatric and adult subjects, and across different laboratory settings internationally.
This is exactly the convergent evidence base that characterizes a maturing measurement technology. Bio-Well is not a diagnostic replacement for clinical biomarkers. It is a complementary physiological assessment tool that measures a real signal — one that multiple independent methodologies corroborate through entirely different physical means.
Referenced Studies
Full papers accessible via the IUMAB Research Database at iumab.club/gb/science/research
Your HRV Tells One Story.
Bio-Well Adds Another Layer.
Bio-Well and HRV measure the same physiological reality through different lenses. Used together, they give practitioners a richer, more complete picture of functional state — one that neither provides alone.


Share:
Non-Invasive Screening: 25 Years of Clinical Research on Electrophotonic Parameters
Measurable Change: What Bio-Well Sees Before and After Therapeutic Interventions