In This Guide
- What Does "Energy" Actually Mean in the Body?
- Metabolic Energy: Calories, Joules, and Calorimetry
- Electrical Energy: EEG, ECG, and EMG
- Thermal Energy: Infrared Thermography
- Heart Rate Variability (HRV): The Autonomic Window
- Biophotonic Energy: The Light Your Cells Emit
- Electro-Photonic Imaging (GDV): Mapping the Biofield
- The WHO's Recognition: Energy Medicine Goes Mainstream
- Side-by-Side: Every Method Compared
- How to Get Started
When someone asks "how do you measure energy in the human body?" the answer depends entirely on what kind of energy you mean. Your body produces and uses energy in at least six distinct, measurable forms — and science has developed a different instrument for each one.
Most people know about calories. Fewer know about the electrical signals measured by an EEG or ECG. And until recently, almost no one outside of biophysics research knew that every living cell in your body emits light — measurable photons — that carry information about your health at the deepest level. This guide covers every method, from the familiar to the frontier.
What Does "Energy" Actually Mean in the Body?
In physics, energy is the capacity to do work — measured in joules. In the body, that definition fractures into multiple parallel systems, each operating at a different scale and each requiring its own measurement approach.
Six Forms of Measurable Energy in the Human Body
Understanding which type of energy you want to measure is the first step to choosing the right tool. A fitness tracker measures metabolic output. An EEG measures brain electricity. A GDV camera — like the Bio-Well device — measures the photonic emissions from your fingertips to create a map of your entire biofield.
Let's examine each method in turn.
Metabolic Energy: Calories, Joules, and Calorimetry
The most familiar form of body energy is metabolic — the chemical energy produced when cells convert food into adenosine triphosphate (ATP). This is what people mean when they say they feel "energized" or "drained."
KEY METRIC
~2,000 kilocalories per day
Average daily metabolic energy expenditure for an adult, equivalent to roughly 8,368 kilojoules. Measured via indirect calorimetry (oxygen consumption and CO₂ output).
How it's measured: Indirect calorimetry calculates energy expenditure by measuring the volume of oxygen consumed and carbon dioxide exhaled. Direct calorimetry — placing a person in a sealed, insulated chamber — measures the actual heat they produce. Both are gold standards in exercise physiology and clinical nutrition.
What it tells you: How many calories your body is burning and whether your metabolism favors fats or carbohydrates as fuel. It's critical for athletic training and clinical nutrition.
What it misses: Metabolic measurement says nothing about your nervous system state, emotional balance, organ-level energy distribution, or biofield coherence. You can burn 2,000 calories and still feel completely depleted — because metabolic energy is only one layer.
Electrical Energy: EEG, ECG, and EMG
Your body runs on electricity. Neurons fire at up to 100 millivolts. Your heart generates the strongest electromagnetic field of any organ — measurable several feet from the body. Every muscle contraction is an electrical event.
EEG
Electroencephalogram — measures brain wave activity via scalp electrodes. Frequency bands (delta, theta, alpha, beta, gamma) indicate states from deep sleep to focused attention.
ECG / EKG
Electrocardiogram — measures the electrical activity of the heart. The gold standard for cardiac health, detecting rhythm disorders, ischemia, and structural abnormalities.
EMG
Electromyogram — measures electrical activity in skeletal muscles. Used in neurology, rehabilitation, and sports science to assess muscle function and nerve integrity.
What these miss: Electrical measurements are organ- or system-specific. An EEG tells you about brain states but nothing about digestive energy. An ECG maps the heart but not the liver. None of them capture the integrated, whole-body energy picture — which is precisely what biophotonic methods aim to do.
Thermal Energy: Infrared Thermography
Every cell in your body radiates heat in the infrared spectrum. Infrared thermography cameras detect these emissions to produce thermal maps of the body surface, revealing areas of abnormal blood flow, inflammation, or metabolic activity.
Clinical applications include breast cancer screening adjuncts, musculoskeletal injury assessment, and vascular disorder detection. It's entirely passive and non-invasive — the camera simply reads the infrared radiation your body naturally emits.
Limitation: Thermography is a surface measurement. It cannot assess deep organ function, chakra alignment, meridian flow, or the overall coherence of your biofield. It captures heat — not light.
Heart Rate Variability (HRV): The Autonomic Window
HRV measures the variation in time between consecutive heartbeats. Counter-intuitively, more variation is healthier — it indicates a flexible, responsive autonomic nervous system that can shift between sympathetic (fight-or-flight) and parasympathetic (rest-and-digest) states.
Research Highlight
A 2004 study funded by Estee Lauder's New Venture Technologies division found a significant correlation between GDV (Bio-Well) parameters and HRV measures, suggesting that both instruments are detecting overlapping aspects of the same underlying energy state.
Source: Glenn R. "A Correlation Between GDV and HRV Measures: A New Measure of Wellbeing." Published via IUMAB research database.
This GDV-HRV correlation is important because it means that Bio-Well's energy scan captures information that overlaps with — and extends beyond — what HRV alone can tell you. HRV gives you the autonomic component; GDV gives you the full energetic picture.
Biophotonic Energy: The Light Your Cells Emit
This is where energy measurement moves into territory most people have never encountered. Every living cell in your body emits ultra-weak photons — light particles in the 200–800 nanometer range. These are not metaphorical. They are physically measurable electromagnetic radiation, detected by photomultiplier tubes sensitive enough to count individual photons.
Timeline: Biophoton Science
German biophysicist Fritz-Albert Popp (1938–2018) first coined the term "biophoton" in 1984 to describe photons of non-thermal origin in the UV-visible spectrum emitted by biological systems. His research at the International Institute of Biophysics in Neuss, Germany — a network of 19 research groups across 13 countries — demonstrated that biophoton emission is correlated with cellular health, metabolic function, and intercellular communication.
Published source: Popp, F.A. "Properties of biophotons and their theoretical implications." Indian Journal of Experimental Biology, 41(5):391-402, 2003. PMID: 15244259. — Popp demonstrated that biophoton emission displays a few to several hundred photons per second per cm² surface area, within the spectral range of 200 to 800 nm, and is closely linked to delayed luminescence of biological tissues.
A key finding: healthy cells emit more coherent biophotons than diseased cells. Coherence here means the photons are synchronized — their wave patterns align. When coherence drops, it signals cellular stress, DNA damage, or metabolic disruption. This finding opened the door to using photon emission as a diagnostic indicator.
Published source: Popp, F.A., Gu, Q., Li, K.H. "Biophoton emission: experimental background and theoretical approaches." Modern Physics Letters B, 8(21-22):1269-1296, 1994. DOI: 10.1142/S0217984994001266. — The results indicate that biophoton emission can be assigned to a coherent field within living organisms, with functions in intra- and intercellular regulation and communication.
A comprehensive 2024 review in PMC confirmed that biophoton research has advanced significantly since Popp's era, noting that biophotons are now recognized as important mediators of cellular communication, metabolic regulation, and neural signaling — and that the detection technology continues to improve rapidly.
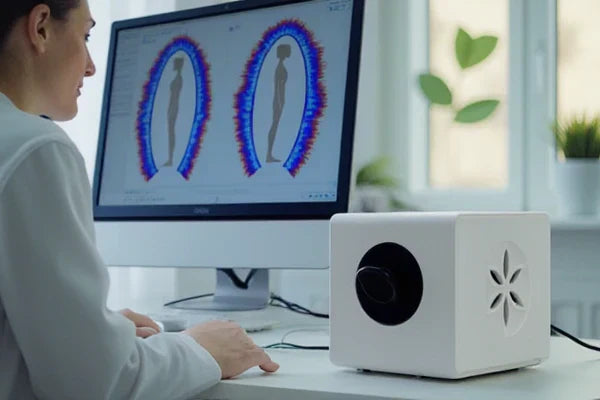
Electro-Photonic Imaging (GDV): Mapping the Biofield
Gas Discharge Visualization (GDV) — also called Electro-Photonic Imaging (EPI) — is the technology that bridges biophoton science with practical, clinical energy assessment. Developed in 1995 by Professor Konstantin Korotkov, PhD, a physicist at Saint Petersburg State University (now Saint Petersburg Federal University of Information Technologies, Mechanics and Optics), GDV applies a brief, controlled high-voltage electromagnetic pulse to the fingertips.
How Bio-Well's GDV Technology Works
The electrical pulse causes photo-electron emission — photons and electrons cascade from the fingertip, amplified in a gas discharge around the electrode, and captured by a CCD camera. The resulting image is then processed by Bio-Well's software, which maps the emission patterns to specific organs and body systems via the meridian connections established in traditional Chinese medicine (TCM) and validated through decades of clinical studies.
Published source: Korotkov, K. "Review of EPI papers on medicine and psychophysiology published in 2008–2018." International Journal of Complementary & Alternative Medicine, 11(6), 2018. DOI: 10.15406/ijcam.2018.11.00417. — A systematic review of a decade's worth of EPI/GDV research across medicine and psychophysiology, confirming the method's reliability and growing clinical evidence base.
With over 400 academic publications referencing GDV/EPI technology and studies conducted at institutions including Jackson State University, the Lithuanian University of Health Sciences, UCLA's Center for Health Sciences, and the University of Arizona's Laboratory for Advances in Human Consciousness and Health, the evidence base continues to grow.
Selected Published Studies Using Bio-Well / GDV
Diabetes Correlation Study
Journal of Evidence-Based CAM, 2016 — Significant correlation between EPI parameters and fasting blood sugar in normal, pre-diabetic, and diabetic participants.
Preventive Healthcare
Jackson State University, 2009 — Bio-electrographic method validated as a screening tool for preventive healthcare in a university population.
COPD Emission Analysis
Lithuanian University of Health Sciences, 2024 — EPI analysis distinguished energy patterns between healthy subjects and chronic obstructive pulmonary disease patients.
Colon Tumor Identification
The Open Biomedical Engineering Journal, 2016 — Engineering approach using EPI data achieved meaningful classification accuracy for identifying colon tumor patients.
Leukocyte Correlation
Journal of Education, Health and Sport, 2021 — Causal relationships confirmed between GDV parameters and white blood cell profiles (leukocytograms).
Olympic Athletic Performance
Human Physiology, 2005 — Psychophysiological correlates of athletic success measured via GDV in athletes training for the Olympics. Funded by Russian Ministry of Sport.
The WHO's Recognition: Energy Medicine Goes Mainstream
On January 1, 2022, the World Health Organization's 11th revision of the International Classification of Diseases (ICD-11) officially came into effect. For the first time in the history of global health standards, it includes Chapter 26: "Supplementary Chapter Traditional Medicine Conditions — Module 1" — codifying diagnostic categories from traditional Chinese medicine including energy patterns, meridian-based diagnoses, and conditions related to energy flow.
Published source: World Health Organization. "Traditional Medicine." who.int/standards/classifications/frequently-asked-questions/traditional-medicine — Chapter 26 provides diagnostic categories to collect and report on Traditional Medicine conditions in a standardized and internationally comparable manner.
Published source: Aung, S.K.H. et al. "Incorporation of complementary and traditional medicine in ICD-11." BMC Medical Informatics and Decision Making, 22(Suppl 6):381, 2022. PMID: 35773641. — Describes the creation of Chapter 26 and its 150 disorders and 196 patterns based on traditional Chinese medicine diagnostic language.
This is significant because it means that energy-based diagnostic concepts — including the meridian system that Bio-Well uses to map fingertip emissions to organs — are now part of the internationally recognized medical classification framework used in over 180 countries.
Traditional medicine is practiced in various forms across more than 180 countries. The ICD-11 inclusion enables standardized counting, comparing, and monitoring of traditional medicine encounters — a prerequisite for the evidence-based integration of energy medicine into global healthcare systems.
Side-by-Side: Every Method Compared
| Method | Measures | Invasive? | Speed | Scope | Best For |
|---|---|---|---|---|---|
| Calorimetry | Metabolic output | No | 15–30 min | Whole-body metabolism | Nutrition, athletics |
| EEG | Brain electricity | No | Real-time | Brain only | Neurology, sleep |
| ECG | Heart electricity | No | Real-time | Heart only | Cardiac diagnosis |
| Thermography | Surface heat | No | Instant | Body surface | Inflammation, vascular |
| HRV Monitor | Heartbeat variation | No | 2–5 min | Autonomic nervous system | Stress, recovery |
| Bio-Well (GDV) | Photon emission | No | < 3 min | Full body + organs + chakras | Holistic energy assessment |
Note: No single method replaces the others. The most comprehensive approach combines methods — for example, pairing HRV monitoring with Bio-Well's GDV scan, as the published correlation study suggests these capture complementary dimensions of the same underlying energy state.
How to Get Started
If you're curious about measuring your energy field, you have two paths:
Find a Practitioner
Book a session with a certified Bio-Well practitioner near you. No equipment needed — just show up, get scanned, and receive your full biofield report.
Find a Practitioner →Get Your Own Device
For practitioners, researchers, or wellness seekers who want unlimited scans. The Bio-Well Starter Pack includes the device, software subscription, and calibration tools.
View Starter Pack →Sources Cited in This Article
- Popp, F.A. "Properties of biophotons and their theoretical implications." Indian J Exp Biol. 2003;41(5):391-402. PMID: 15244259.
- Popp, F.A., Gu, Q., Li, K.H. "Biophoton emission: experimental background and theoretical approaches." Modern Physics Letters B. 1994;8(21-22):1269-1296. DOI: 10.1142/S0217984994001266.
- Korotkov, K. "Review of EPI papers on medicine and psychophysiology published in 2008–2018." Int J Complement Alt Med. 2018;11(6). DOI: 10.15406/ijcam.2018.11.00417.
- Glenn, R. "A Correlation Between GDV and HRV Measures: A New Measure of Wellbeing." New Venture Technologies / Estee Lauder Companies, 2004. Published via IUMAB.
- Aung, S.K.H. et al. "Incorporation of complementary and traditional medicine in ICD-11." BMC Med Inform Decis Mak. 2022;22(Suppl 6):381. PMID: 35773641.
- World Health Organization. "Traditional Medicine" FAQ. who.int/standards/classifications/frequently-asked-questions/traditional-medicine.
- "Bio-electrographic Method for Preventive Health Care." Jackson State University, 2009. Published via IUMAB.
- "Electro-Photonic Emission Analysis in Patients with COPD." Lithuanian University of Health Sciences, 2024. Published via IUMAB.
- "Engineering Approach to Identifying Patients with Colon Tumors on the Basis of EPI Data." Open Biomedical Engineering Journal, 2016.
- "Causal Relationships Between GDV Parameters and Leukocytogram." J Education, Health and Sport, 2021.
- "Psychophysiological Correlates of Athletic Success in Athletes Training for the Olympics." Human Physiology, 31, 2005.
- "Correlation of Electrophotonic Imaging Parameters With Fasting Blood Sugar." J Evidence-Based Complementary & Alternative Medicine, 2016.
- Zarkeshian, P. et al. "Ultra weak photon emission — a brief review." PMC, 2024. PMC10899412.
Up Next in This Series
What Is a GDV Camera? The Science of Gas Discharge Visualization
From Nikola Tesla's 1891 experiments to Bio-Well 3.0 — the complete history of the technology that lets you see energy.
Read Tomorrow's Post →

Share:
One Liter a Day. Thirty Days. This Is What Changed.
What is a GDV camera? the science of gas discharge visualization