In This Guide
- GDV Camera: A Definition
- 135 Years of Discovery — Tesla to Bio-Well
- The Physics: How Photon Emission Becomes Data
- GDV vs. Kirlian Photography: What Changed
- The Meridian Connection: Fingertips to Organs
- GDV Camera Chakra Analysis: What It Reveals
- Clinical Evidence: What GDV Actually Detects
- Choosing a GDV Device: What to Look For
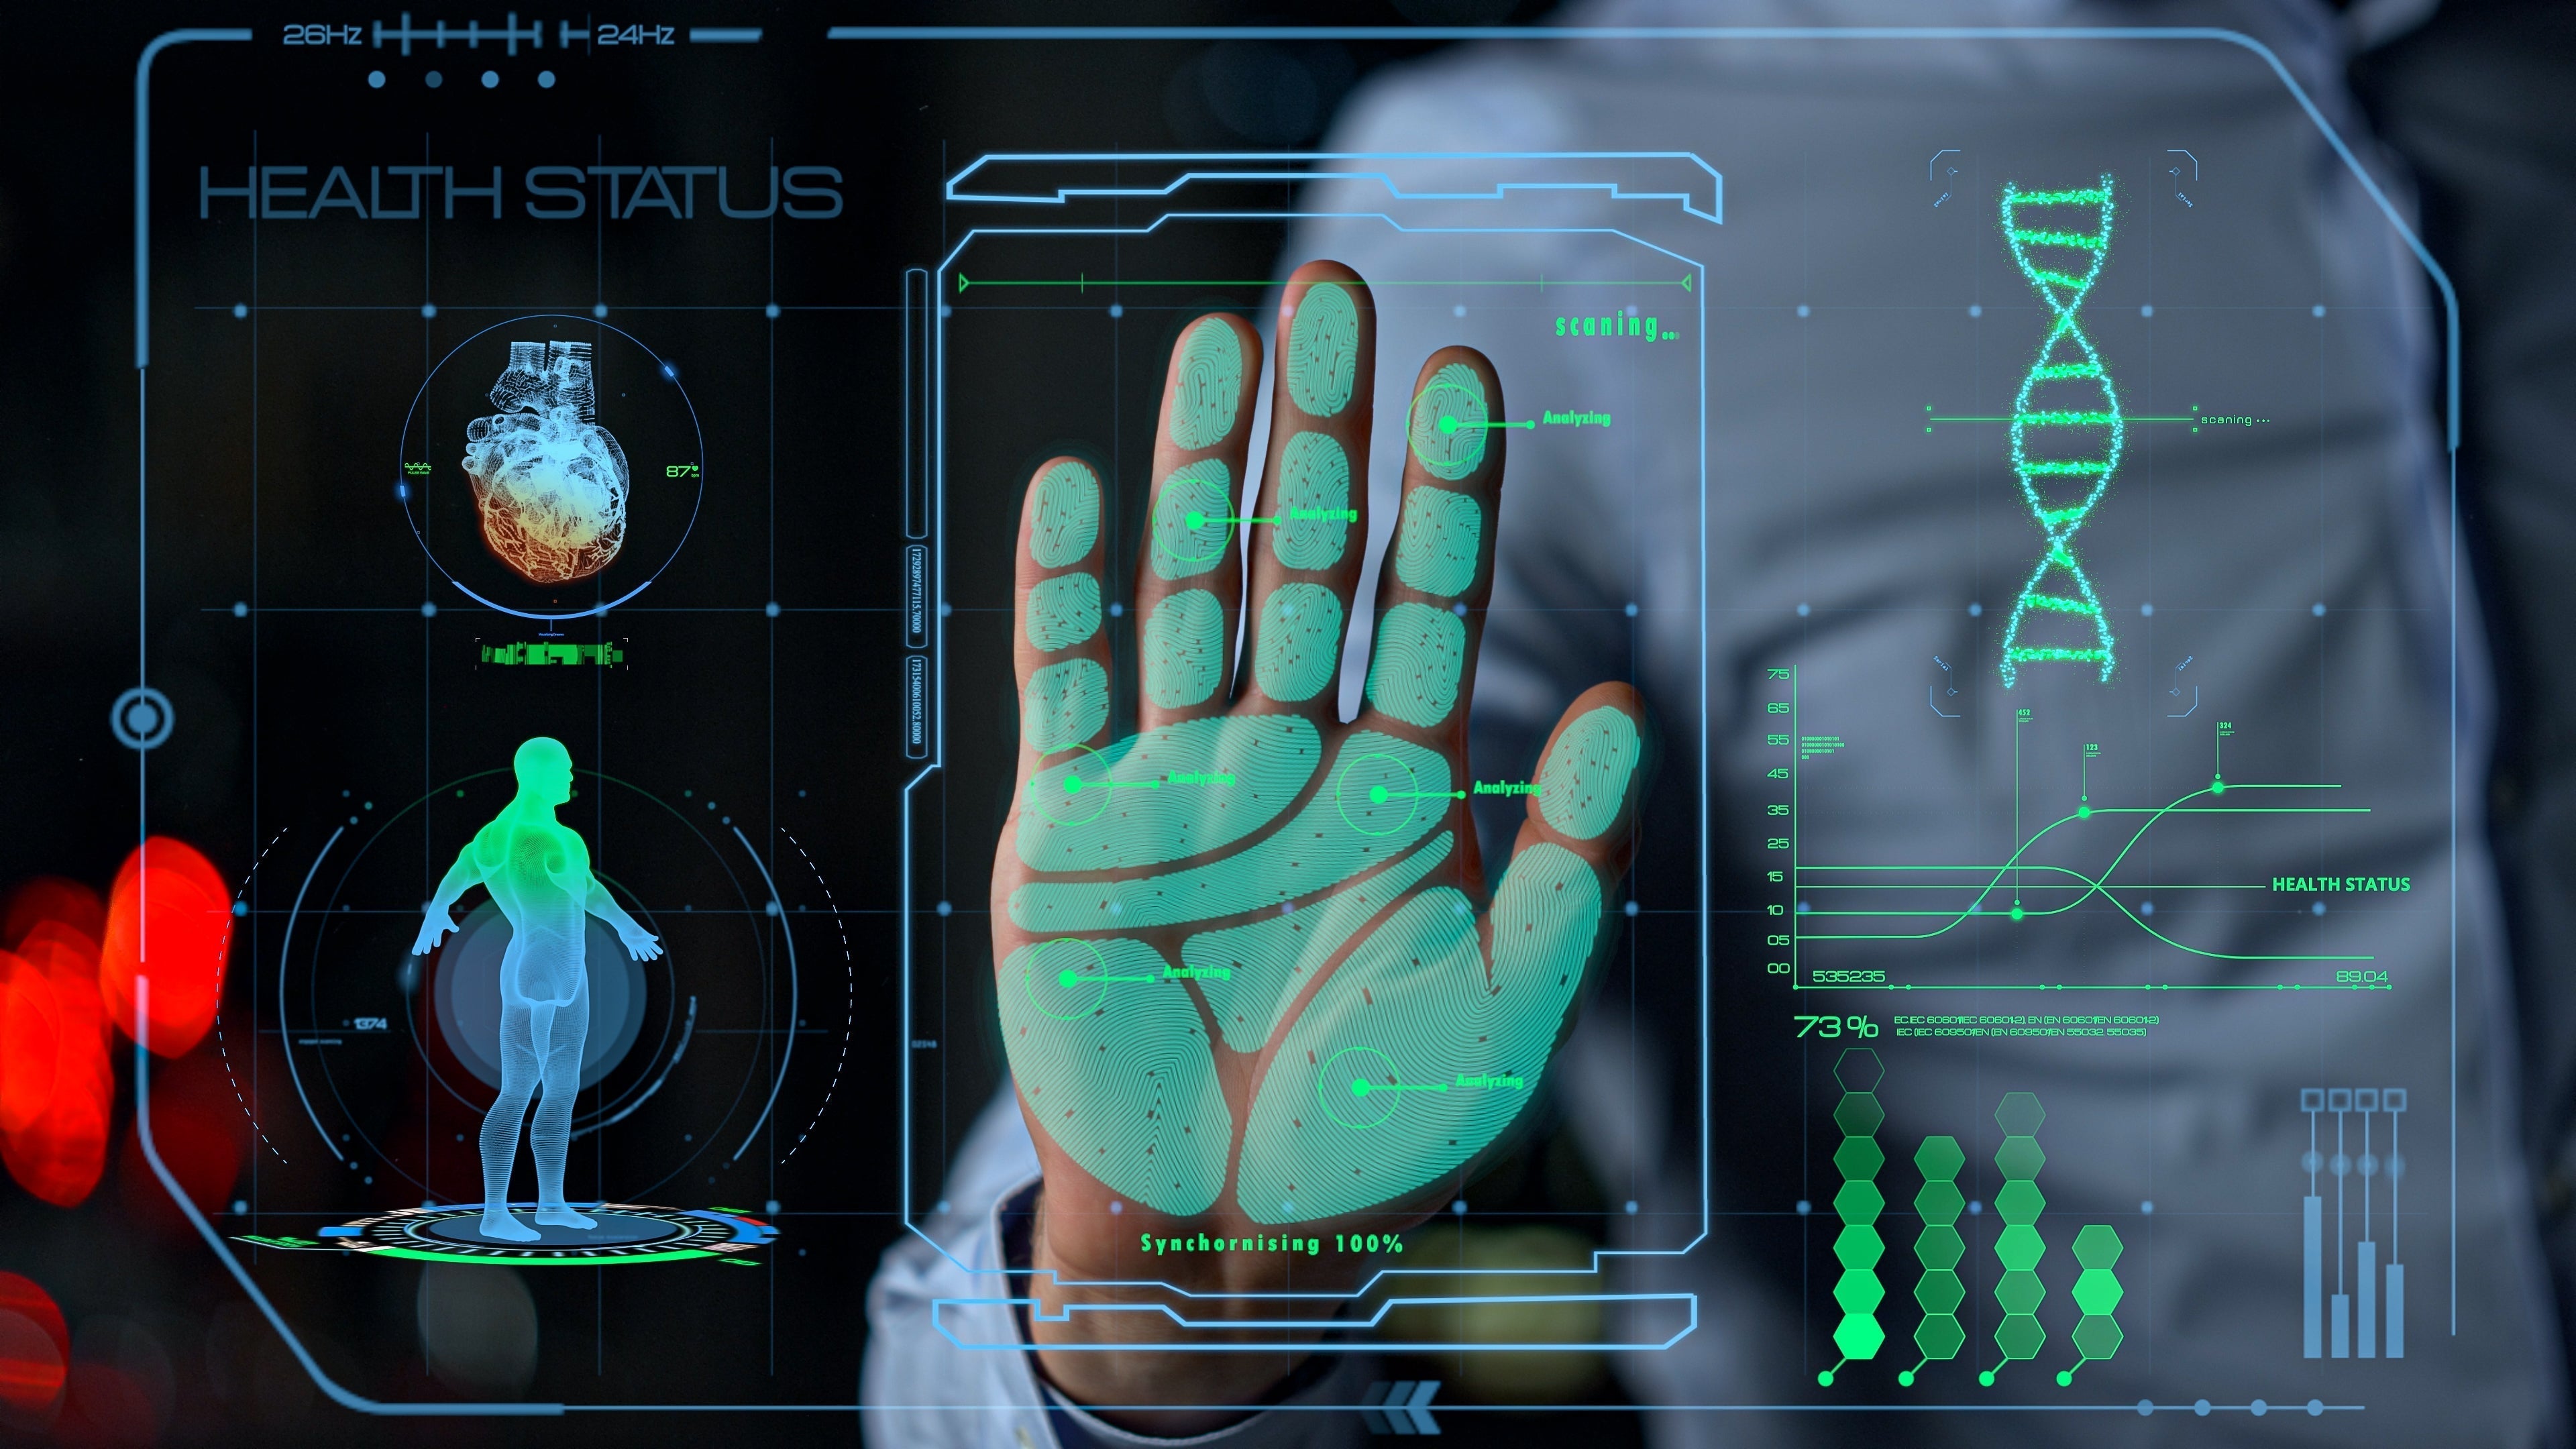
A GDV camera — short for Gas Discharge Visualization camera — is a bioelectrographic device that captures the photon emissions from living tissue to produce quantifiable energy maps. If you've ever wondered what science looks like when it attempts to make the invisible visible, this is it.
The technology sits at the intersection of quantum biophysics, traditional Chinese meridian theory, and modern digital imaging. It took 135 years of experimentation — starting with Nikola Tesla's gas discharge experiments in 1891 — to arrive at today's Bio-Well, the most advanced GDV device available. This guide walks through every layer: the history, the physics, and the clinical evidence.
GDV Camera: A Definition
Definition
A GDV camera is a device that applies a brief, controlled electromagnetic pulse to an object (typically a fingertip) placed on a glass electrode, captures the resulting gas discharge glow with a CCD sensor, and digitizes that image into quantifiable data representing the object's electro-photonic emission state.
The term "Gas Discharge Visualization" describes the core physical process: when a brief high-voltage pulse (typically 10–15 microseconds) is applied, gas molecules surrounding the fingertip become excited and emit visible light — a controlled, measurable corona discharge. The CCD camera captures this glow, and software translates the image parameters (area, brightness, fractal dimension, entropy) into physiological metrics.
The technology is also known by several other names in the scientific literature: Electro-Photonic Imaging (EPI), bioelectrography, and — in its earlier, non-digital forms — Kirlian photography.
135 Years of Discovery — Tesla to Bio-Well
The science behind GDV cameras didn't emerge overnight. It's the product of over a century of experimentation by physicists, engineers, and biophysicists across multiple continents.
1777
Lichtenberg Figures
German physicist Georg Christoph Lichtenberg becomes the first person to observe a corona discharge from a human hand, recording branching electrical patterns in resin dust — early precursors to all gas discharge imaging.
1891
Tesla's Gas Discharge Experiments
Nikola Tesla demonstrates high-frequency gas discharge effects before the American Institute of Electrical Engineers, producing photographs of luminous auras around objects — the first systematic documentation of electrically-induced corona discharge imaging.
1893–1895
Narkevich-Yodko's Electrophotography
Byelorussian scientist Jacob Narkevich-Yodko produces over 1,500 electrophotographic images of fingers, plants, and grains. His work is celebrated at a dedicated electrography conference at St. Petersburg University in 1893 and earns recognition across Europe's scientific institutions.
1939
Kirlian Photography Is Born
Russian electrical engineer Semyon Kirlian and his wife Valentina accidentally discover that objects on a photographic plate connected to a high-voltage source produce vivid corona discharge images. They publish their findings in 1958, revealing that fingertip auras vary with emotional states.
1970–1976
Western Science Investigates
UCLA's Dr. Thelma Moss and Kendall Johnson conduct extensive Kirlian research at the Center for Health Sciences. In 1976, a multidisciplinary team led by William Eidson at Drexel University publishes a six-year study documenting real-time imaging of electrical parameters around living tissue, addressing variables that affect image formation and establishing foundational methodology.
Source: Eidson et al., Drexel University. Published 1976/1978 via U.S. Department of Defense documentation. Also: Pehek, Kyler, and Faust, "Image Modulation in Corona Discharge Photography," Science, 194(4262):263-270, 1976.
1986
Mandel Connects Kirlian to Meridians
German naturopath Peter Mandel develops Energy Emission Analysis (EEA), the first systematic method for interpreting Kirlian fingertip images through their connection to TCM meridian endpoints — laying the diagnostic framework that GDV would later digitize.
1995 — THE BREAKTHROUGH
Korotkov Creates GDV Technology
Professor Konstantin Korotkov, PhD — a physicist at Saint Petersburg State University — develops Gas Discharge Visualization, replacing photographic film with a CCD camera and computer analysis. For the first time, bioelectrographic imaging becomes quantifiable, reproducible, and standardized. This is the single most important advancement in the field's 100+ year history.
Source: Korotkov, K. "Review of EPI papers on medicine and psychophysiology published in 2008–2018." Int J Complement Alt Med. 2018;11(6). DOI: 10.15406/ijcam.2018.11.00417.
2023
Bio-Well 3.0 Released
The third generation Bio-Well device launches — integrating advanced CCD imaging, improved software analytics, refined calibration systems, and a database of over one million scanned subjects for predictive analytics. It represents the current state of the art in commercial GDV technology.
The Physics: How Photon Emission Becomes Data
At the physical level, a GDV camera operates through a well-understood process called gas discharge — the same phenomenon that makes neon signs glow. Here's what happens in each scan:
The GDV Measurement Process
Five parameters the software extracts from each fingertip glow:
Area
Total glow size in pixels
Intensity
Brightness / photon density
Entropy
Disorder / information density
Fractality
Edge complexity pattern
Symmetry
Left/right balance
These parameters are not arbitrary — each correlates with specific physiological states. For example, reduced glow area in a specific fingertip sector has been associated with reduced energy in the corresponding organ system, while asymmetry between left and right hands can indicate autonomic nervous system imbalance.
GDV vs. Kirlian Photography: What Changed
People often ask whether a GDV camera is just "modern Kirlian photography." The answer is: it evolved from the same physical phenomenon, but the two are as different as a daguerreotype and a digital MRI.
| Feature | Kirlian Photography 1939–1990s |
GDV / Bio-Well 1995–present |
|---|---|---|
| Capture medium | Photographic film | CCD digital sensor |
| Output | Visual image only | Quantified data + image |
| Reproducibility | Low (many uncontrolled variables) | Standardized protocol |
| Processing | Manual darkroom | Instant computer analysis |
| Calibration | None / inconsistent | Built-in calibration unit |
| Organ mapping | Subjective interpretation | Algorithmic meridian mapping |
| Published studies | Limited, mixed results | 400+ academic publications |
The critical difference is standardization. Early Kirlian photography was sensitive to hundreds of environmental variables — moisture, pressure, voltage, temperature — making consistent results nearly impossible. Korotkov's GDV system addressed this by controlling the electrical parameters, adding calibration protocols, and replacing subjective visual interpretation with computer algorithms trained on over a million scan subjects.
The Meridian Connection: Fingertips to Organs
Here's what makes GDV fundamentally different from any other imaging technology: it doesn't just capture an image — it maps that image to your body's organ systems using the meridian connections established in traditional Chinese medicine.
In TCM, each fingertip is an endpoint (or starting point) of one or more of the body's 12 primary meridians — energy pathways that connect to specific organ systems. This framework has been codified in medical practice for thousands of years and is now recognized in the WHO's ICD-11 (Chapter 26). When Bio-Well scans all 10 fingers, each sector of each fingertip glow is algorithmically assigned to its corresponding organ or system.
How Bio-Well Maps Each Finger
Each of 10 fingertips is divided into sectors. Each sector maps to specific organs via meridian connections.
Published source: Blacklock, N.F. "Imaging the Bio-Field: The use of Kirlian Photography to image the Qi of the body via the Eight Extraordinary Meridians." Uses computerized GDV technology developed by Dr. Korotkov to demonstrate correlation between energy emission at fingertips and the Qi of the Eight Extraordinary Vessels as understood in TCM.
GDV Camera Chakra Analysis: What It Reveals
One of the most requested features of Bio-Well's software is its chakra analysis view. By synthesizing the organ and system data from all 10 fingertips, the software computes the energy state of each of the seven major chakras — energy centers described in Ayurvedic medicine that correspond to specific physiological and psychological functions.
The Seven Chakras as Mapped by Bio-Well Software
Crown (Sahasrara)
Higher consciousness, spiritual connection. Mapped from brain-related fingertip sectors.
Third Eye (Ajna)
Intuition, pituitary gland, nervous system. Mapped from endocrine and brain sectors.
Throat (Vishuddha)
Communication, thyroid, respiratory system. Mapped from lung and throat sectors.
Heart (Anahata)
Love, compassion, cardiovascular system. Mapped from heart and circulation sectors.
Solar Plexus (Manipura)
Personal power, digestion, liver, pancreas. Mapped from digestive organ sectors.
Sacral (Svadhisthana)
Creativity, reproductive system, kidneys. Mapped from urogenital sectors.
Root (Muladhara)
Survival, adrenals, skeletal system. Mapped from adrenal and musculoskeletal sectors.
The chakra view presents each energy center as aligned, over-active, or under-active — providing practitioners and patients with an intuitive visual of their overall energetic balance. This is especially useful for modalities like yoga, Reiki, and meditation, where practitioners target specific chakras.
Clinical Evidence: What GDV Actually Detects
The question isn't whether GDV cameras produce images — they clearly do. The question is whether those images contain clinically meaningful information. Published studies suggest yes, across multiple medical domains:
400+
Academic Publications
GDV/EPI technology has been the subject of over 400 published papers worldwide, across disciplines including cardiology, oncology, sports medicine, psychology, and preventive healthcare. The full research database is maintained by the International Union of Medical and Applied Bioelectrography (IUMAB).
Choosing a GDV Device: What to Look For
If you're evaluating GDV cameras — whether for a clinical practice, research lab, or personal wellness — here are the critical features that separate serious instruments from novelty products:
Built-in Calibration
The device must calibrate to a known standard before each session. Without this, results are unreliable. Bio-Well includes a calibration unit in every package.
CCD Sensor (Not Film)
Digital capture with a CCD sensor produces quantifiable, reproducible data. Any device still using photographic film is pre-1995 technology.
Software Analytics
Look for organ mapping, chakra analysis, stress index, and before/after comparison tools. Bio-Well's software is backed by a database of 1M+ scans.
Published Validation
The device should have peer-reviewed studies backing its reliability. Bio-Well is referenced in 400+ publications across named institutions.
Ready to experience GDV technology?
Book a free demo to see Bio-Well — the world's most advanced GDV camera — in action.
Sources Cited in This Article
- Korotkov, K. "Review of EPI papers on medicine and psychophysiology published in 2008–2018." Int J Complement Alt Med. 2018;11(6). DOI: 10.15406/ijcam.2018.11.00417.
- Pehek, J.O., Kyler, H.J., Faust, D.L. "Image Modulation in Corona Discharge Photography." Science. 1976;194(4262):263-270.
- Eidson, W. et al. Drexel University. Published 1976/1978 via U.S. Department of Defense documentation. Six-year multidisciplinary study on real-time biofield imaging.
- "Kirlian photography." Wikipedia. Historical and scientific overview including Moss/Johnson UCLA research and Korotkov GDV development.
- Blacklock, N.F. "Imaging the Bio-Field: The use of Kirlian Photography to image the Qi of the body via the Eight Extraordinary Meridians." GDV-meridian correlation study.
- "Correlation of Electrophotonic Imaging Parameters With Fasting Blood Sugar." J Evidence-Based CAM, 2016.
- "Evaluation of EPI Indicators in Patients with Non-Communicable Diseases — Coronary Heart Disease." Ukrainian Medical Stomatological Academy, 2021.
- "Prediction of competitive readiness of Paralympic athletes by GDV." Russian Ministry of Sport, 2016.
- "Causal Relationships Between GDV Parameters and Leukocytogram." J Education, Health and Sport, 2021.
- "GDV Analysis of Arterial Hypertension." Russian Federal Medical University, 2009.
- "Electro-Photonic Emission Analysis in Patients with COPD." Lithuanian University of Health Sciences, 2024.
- Aung, S.K.H. et al. "Incorporation of complementary and traditional medicine in ICD-11." BMC Med Inform Decis Mak. 2022;22(Suppl 6):381. PMID: 35773641.

Share:
How to measure energy in the human body: the complete guide
What is a biofield? scientific evidence for the human energy field